Natural Gas

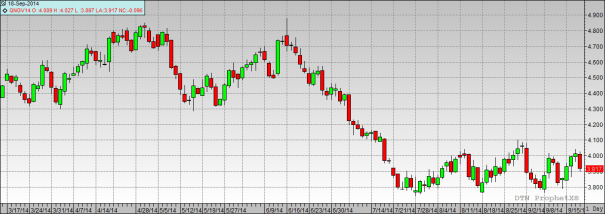
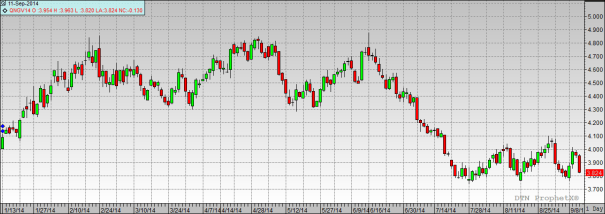
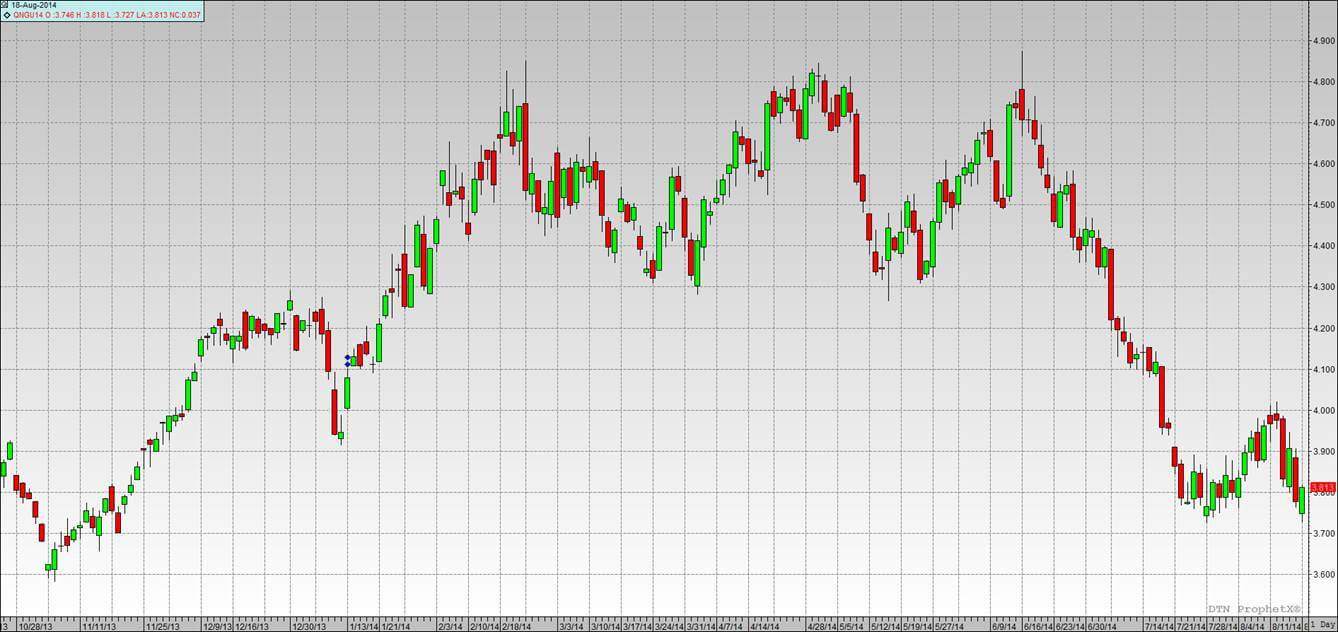
For the 23rd week in a row – the Natural Gas Storage Report has shown a build up of gas in storage greater than the 5-year average for the corresponding week.  This means we should continue to see gas prices remaining within the narrow trading range of $3.75 – $4.10.

This week’s report also exceeded the analyst’s expectations as well.  The poll by the Wall Street Journal showed the experts were looking for an increase of 92 bcf.  The report surprised most showing an increase of 97 bcf.  Last year the increase for this week was 82 bcf and the corresponding 5-year average was 71 bcf.

The natural gas in storage this year is now only 386 bcf lower than than last year.  Fears of not having enough gas in storage to meet the country’s needs this winter continue to subside.  Prices for gas and electricity should remain fairly steady until we see what our winter weather provides us this year.

9-18-2014 Market Commentary with NG Chart

NEW YORK–Natural-gas futures retreated from $4 Thursday after a weekly stockpile update showed a larger surplus than expected.

Producers added 90 billion cubic feet of gas to storage for the week ended Sept. 12, the U.S. Energy Information Administration said. The addition was 1 bcf larger than the 89 bcf consensus average expectations of analysts and brokers in The Wall Street Journal survey.

Natural gas for October delivery dipped as low as $3.897 a million British thermal units, losing 1.9% in the minute after the data release. It gained some of that back and the front-month contract recently traded down 9 cents, or 2.1%, for the day at $3.91 a million British thermal units on the New York Mercantile Exchange.

Traders use the EIA update to gauge how quickly stockpiles are recovering from high demand that drained them to 11-year lows this winter. Last week’s addition refilled stockpiles to 2.9 trillion cubic feet, about 13% below the five-year average level for that week of the year. It had been at less than half of the average at the start of spring.

9-18-14 NG Chart

Click here to view chart at full size.

9-11-2014 Market Commentary with NG Chart

NEW YORK–Natural-gas futures sank deeper Thursday morning after a weekly stockpile report showed a larger surplus than expected.

Producers added 92 billion cubic feet of gas to storage for the week ended Sept. 5, the U.S. Energy Information Administration said. The addition was 10 bcf larger than the 82 bcf consensus of analysts and brokers in The Wall Street Journal survey. It was also larger than any of the projections, which topped out at 89.

Natural gas for October delivery immediately lost 1.7% after the data release, adding to incremental losses from early-morning trading. The front-month contract recently traded down 13 cents, or 3.3%, for the day at $3.824 a million British thermal units on the New York Mercantile Exchange.

Traders use the EIA update to gauge how quickly stockpiles are recovering from high demand that drained them to 11-year lows this winter. Last week’s addition refilled stockpiles to 2.8 trillion cubic feet, about 14% lower than the five-year average level for that week of the year. It had been at less than half of the average at the start of spring.

9-11-14 NG Chart

Click here to view chart at full size.

Natural Gas

For the twentieth (20) straight week the increase of natural gas in storage has exceeded the 5-year average.  Back in April you will remember we were 50% below the 5-year average, and this morning’s report shows we are now only 15.4% short of the average for this time of the year.

Record production of gas and cooler temperatures are pushing up the amount of gas we have in storage, and therefore we should get back to the 3,500 – 3,600 bcf of gas we will need in storage to get us through another cold winter.  The analysts were expecting an increase in this morning’s Natural Gas Storage Report to be 73 bcf, and it came in with a nice plus 79 bcf.

The current gas contract (October) has been in a trading range, as you know, between $4.10 and $3.72.  This morning’s report pushed the price down to a low of $3.789 and is currently trading right at $3.80, near the lower end of this range.  The experts look for our weather to be cold this winter, but not as cold as last year.  They expect the price of gas to move up to a trading range of $4.40 to $4.10.  September and October should be great for locking in today’s lower rates.

A couple of new items – first, you all should have received our official change of address notice so you should have the new home office address and phone numbers.

Second, welcome Dan McCaslin on board with Power Energy USA.  Dan joined us yesterday and is in the Round Rock – Austin area.

The Future of the Natural Gas Market Part One: Macro Drivers of Supply

Natural Gas Market Changes

Natural gas has become a central subject of discussion within the energy market over the past several years. There are many reasons for this. First, the gas industry has experienced extraordinary success during the last decade. Horizontal drilling and the large-scale development of shale basins in the U.S. have become economically reasonable. Liquefied natural gas (LNG) technologies which have been around since the 1950s are now commercially viable. As a result, unlike other fossil fuels, natural gas is now widely used, and this usage continues to increase in most sectors of the modern economy: power generation, manufacturing, transportation, and more traditional areas, such as commercial and residential end-use consumption.

The LNG trade has expanded rapidly around the world, and interconnected networks of gas pipelines have and are still being developed inside and around Europe and Middle Asia. The natural gas industry is now facing a number of new challenges and opportunities related to both its demand and supply. On the demand side, the implementation of green energy policies will lead to a substantial increase in future gas demand. On the supply side, new natural gas resources are emerging around the world, mainly because of an increase in global LNG supply and the shale gas revolution. This unprecedented shift in the supply/demand balance for many countries is creating new market dynamics and altering gas pricing mechanisms. This article, the first in a two-part series that explores changes to the natural gas market, will provide a succinct overview of factors that will surely affect natural gas pricing mechanisms.

Natural Gas Market Macro Drivers

Effective analysis of the interaction between drivers of natural gas demand requires recognition of the uncertainty involved in this process. Simple forecasts or scenarios are unlikely to do justice to the complexities of the industry. Instead, an analytical framework is required to adequately capture the interaction between macro drivers of natural gas demand and alternative sources of gas supply. In this article, I lay groundwork for an effective analytical framework, based on the factors illustrated in Figure 1.

Figure 1

Figure 1: Macro Drivers of the Future Natural Gas Market

Read the rest of this entry »

8-18-2014 Market Commentary with NG Chart

Natural-gas prices wavered Monday as weather forecasts for the last half of August continued to point to cooler weather.

Natural gas for September delivery was up 3 cents, at $3.81 a million British thermal units on the New York Mercantile Exchange, after slipping to $3.727 in early trade. Prices are now 20% below their mid-June peak, as robust inventory growth has disproven market views that high summer cooling demand would strain supplies.

“As we shuffle away from the peak of summertime and toward the peak of hurricane season, both have been lacking in their usual bullish impact,” Schneider Electric analyst Matt Smith said in a note.

Temperatures along the Eastern Seaboard continued to moderate in the two-week outlook, and a Canadian storm formation is expected to sweep down across the northern U.S., further reducing demand for natural gas. Utilities use gas to generate electricity, and demand rises in hot weather to cool offices and homes.

Traders are looking ahead to weekly storage data on Thursday from the U.S. Energy information Administration, which is expected to show yet another addition to stockpiles that is much higher than average. Current inventory levels are 19% below average levels, but more than two months remain for utilities to add supplies to storage before demand for gas to heat homes kicks in.

image004

Click the image to view it larger.


Load curtailment from DR to triple over the next 7 years

Demand response (DR) programs have become a key part of utilities’ business strategies over the last decade. Shifting load to off-peak hours in order to better manage increasing demand for electricity, DR has proven to be an important resource, evolving from being used in emergency programs infrequently to a critical resource in existing capacity markets, as well as a critical element of the smart grid. In fact, load curtailment from DR programs in residential, commercial, and industrial situations will nearly triple over the next seven years, from 57.8 GW to 140.5 GW in 2020, according to Navigant Research.

“Today, nearly three-quarters of demand response activity takes place in the United States,” said Brett Feldman, senior research analyst with Navigant Research. “With a few exceptions, utilities in Europe and Asia Pacific have only recently become interested in using DR to balance the supply and demand of electric power. Many utilities in these regions are expected to ramp up their adoption of DR in the years ahead.”

One of the most important technological developments in the DR market during the last 10 years has been the automation of DR processes.  Automated DR (ADR) typically involves minimal or no manual intervention and has substantially improved the efficiency, cost effectiveness, reliability, and speed of peak reduction and grid balancing. More than 37,400 sites across the world were enabled for ADR in 2013, and ADR-enabled sites are expected to reach more than 151,000 sites by 2020, Navigant predicts.

For more, see this report.

Natural gas & Electricity

Last Thursday’s natural gas storage report was the sixteenth straight week that the natural gas going into storage exceeded the 5-year average for that corresponding week.  And tomorrow we should see the 17th in a row with potentially even more natural gas build up in storage than the week before as analysts are looking for an 80+ bcf increase again.

At the end of last week and the beginning of this week the weather forecasts were for increased temperatures throughout the US, and therefore an increase in the usage of air conditioners and power fueled by natural gas.  Prices for natural gas contracts moved upward along with electricity rates.  For two days this week the current gas contract touched $4, the top of my previously mentioned trading range.

Today, Wednesday August 13, gas prices have begun to drop significantly, and are down over 10 cents today, dropping back into the $3.80’s per contract.  I still maintain we will see gas prices fluctuate this summer between $3.60 – $4, with a corresponding fluctuation in electricity rates.  Watch for potentially lower prices in October and maybe November as long as the record production of gas continues.

Natural Gas/Electricity

Yesterday we saw another very good natural gas storage report.  For the 14th straight week the build up of natural gas in storage exceeded the 5-year average.

The poll of the analysts by the Wall Street Journal anticipated a build up of 92 bcf for the week, and the actual build came in a little lower at 88 bcf.  The good part of the report was this is 42 bcf greater than the five year average for the corresponding week.

After the very cold winter the nation faced this past year natural gas in storage had dropped to an 11-year low.  I had mentioned several times we would need natural gas storage build up to exceed the 5-year average by 25 – 35 bcf each week to get back to comfortable levels again in case we face another frigid winter coming up starting in November.

The storage numbers look better each week.  We are now only 530 bcf under last year’s corresponding number and 641 bcf under the five-year average.  Fracking technology has helped the US develop record natural gas production this year, and cooler than normal temperatures this summer throughout the nation have reduced the use of air conditioners therefore saving on electricity and gas usage.

During the last few years $3.80 has been a significant price point for natural gas.  It is also directly in the middle of the current trading range I feel will remain prevalent through the summer of $3.60 – $4.  Natural gas pricing closed today (Friday August 1st) at $3.798.  Today’s prices are now the lowest since last November and a good time to lock in low electricity rates.