Doug Mathes: A Few Words on Energy Pricing Possibilities

Doug Mathes, president of Power Energy, was recently quoted in S&P Global’s article entitled, “Outlook 2019: ERCOT likely to face another summer with low reserve margin.” Doug had this to say on the topic of energy pricing for the coming year:

“The risk of prices settling higher exists due to reserve margin expectations being lower for this coming year, but we are not sold on the fact we will see overall higher prices when looking at the averages.”

Read the full article here.

Electricity Rates

It is too simple to say electricity rates are based on traditional “supply and demand” factors. The “supply and demand” factors with electricity pertain to natural gas, the primary component in the generation of electricity. As natural gas prices rise or fall so do electricity rates rise or fall. The major factors in determining natural gas prices are weather and the amount of natural gas in storage, generally in underground caverns throughout the U.S. The amount of gas in storage is provided each week on Thursday morning at 9:30am (Houston time).

Natural gas is added to the amount in storage each year generally beginning around the first week of April and throughout the summer months in order to accumulate a supply of gas to draw upon for the cold winter months. The drawdown of gas from our storage supply generally begins around the first week of November. The maximum storage capacity in the U.S. is believed to be around 4 trillion cubic feet (“tcf”) of gas. The largest amount of gas ever held in storage since records have been kept was in mid-November 2015 with 4.009 tcf, very near the expected total capacity. With a record amount of gas in storage, and with record production of gas due to the new fracking technologies, gas fell to an inflation-adjusted lowest price in the history of the Nymex trading in December 2015, bringing electricity rates down also to new 11 year lows.

As is normal at the beginning of the year, January gas prices and electricity rates went up as natural gas was drawn from our storage supplies during the coldest month of the winter. Gas prices closed January 29th (the last trading day of the month) at $2.298. As the nation began to forecast and actually start to see warmer weather overall, prices for gas dropped to $1.978 on Thursday, February 4th when the storage numbers came out from the government.

The report on Thursday, February 11th, provided an ongoing view that natural gas prices will continue to go lower, which will also take electricity rates lower. The report this past week showed our gas stockpile fell by only 70 billion cubic feet (“bcf”) which was 14 bcf less than the average forecast, and was significantly less than the corresponding week last year and the five-year average. Natural gas closed the week at $1.966, and should continue to drop. How can I be so sure?

As of the February 11th report this year we have 2.864 tcf of natural gas in storage. This is 573 bcf (+25%) more than last year at this point and 543 bcf (+23%) greater than the 5-year average. Assuming nothing abnormal takes place on the weather front this year, and gas production again increases another 1.5%, as predicted, we will most likely be pushing the limits of our gas storage capacity by September or October. What do we do then – give gas away for free?

Expect new record lows in natural gas prices this year accompanied in parallel with record low electricity rates. One cold winter snap, as in 2013, or a sudden change in governmental policies could change this trajectory, but it is highly unlikely at this point.

So, you should look to lock in these record low electricity rates now for your long term savings. When your electricity contract comes up for renewal this year I recommend you consider signing up for the longest rate term your energy broker can find at the lowest cost for that time frame.

Lock in these rates NOW!

Electricity Rates Will Come Down Again

The price of oil has little to nothing to do with the price of your electricity. Electricity rates are in direct correlation to the price of natural gas, the primary component in producing electricity now. The supply and demand for gas along with North American weather patterns control the price of your electricity in Texas.

Each year we store excess natural gas, generally in underground caverns, throughout the summer months beginning in April in anticipation of the increase in demand for gas for winter heating, especially in the north. Generally gas storage inventories are built up through the end of October, and withdrawals for the winter cold weather begin in the first week of November continuing through the end of March. The increase in production of natural gas in 2015 coupled with the reduction in demand, especially due to the El Nino weather pattern late in 2015, has increased the amount of gas in storage to a new record.

The gas industry was unexpectedly able to ADD more natural gas into storage in each of the first three weeks of November, bringing the total to 4.009 Trillion Cubic Feet (“tcf”)of gas in storage at the end of the third week. This amount broke all previous records for the amount of natural gas in storage, and actually pushed the maximum capacity for gas in storage. This record storage number was then followed by the two middle weeks of December having two of the five lowest drawdowns EVER of gas during any December since they began keeping records. The outcome for halfway through January this year is we have 3.475 tcf of natural gas in storage which is 587 Billion Cubic Feet (“bcf”) greater than in 2015 for the corresponding time frame, and 474 bcf greater than the five-year average.

Two years ago this month natural gas prices were above $6.50 due to the frigid winter weather that year and the increased demand for gas to heat homes and businesses. Today the current gas contract price is around $2.15. Gas hit a 16-year low on December 17th under $1.80. These low natural gas prices are at historical lows for the winter months.

Why then do I believe electricity rates will again go lower? I predict natural gas in storage will bottom out in March between 2.85 tcf – 3.0 tcf. (Morgan Stanly also projects a 3.0 tcf bottom.) The highest amount in the last 5 years of gas in storage at the end of the winter cycle was 2.369 tcf in March, 2012. We should far exceed that amount this year.

If the nation has a maximum storage capacity of around 4 tfc, and we are already 587 bcf ahead of last year’s gas in storage which ended with a new record in November, it is extremely likely we will simply run out of storage capacity for gas in September or October. What do we do with the excess gas – give it away or burn it off?

I am predicting we will see natural gas prices at $1.35 – $1.50 later this year. Electricity prices will fall right along with the price of gas to new lows. When your electricity contracts come due this year you should sign up for a long term program in order to lock these low rates. I do not think the rates we will see in September – October this year will be this low next year and possibly not for the next ten years. Take advantage now and lock in your savings.


By the way –

To go back to my “January, 2016 Predictions for the Year,” it appears we hit many of the new lows I projected on only January 20th.

Oil (WTI) = $25-$28 prediction – closed 1/20 at $26.55 (down 28.32% for ’16);

DJIA = 15,400 – 15,600 “ – hit a low 1/20 of 15450.56 (down 11.31% for ’16);

S&P 500 = 1800 – 1825 “ – hit a low 1/20 of 1812.29 (down 11.33% for ’16);

NASDAQ = 4250 – 4500 “ – hit a low 1/20 of 4313.39 (down 13.86% for ’16);

One of the stocks I cautioned my readers about buying was ConocoPhillips. Amazingly, Merrill Lynch had listed it as their NUMBER ONE BUY for 2016 just before the New Year. ConocoPhillips hit $32.71 per share on 1/20, which is a drop of 29.94% since January 1st. As I mentioned, “BUYER BEWARE.”

2016 Energy Predictions

Power Energy USA is located in Houston, Texas – “the Energy Capital of the U.S.” Power Energy is an energy broker which sells electricity and natural gas in deregulated U.S. markets, and it began in 2015 to sell solar energy throughout the world with its sister company – McLaren Solar, LLC.

My overall prediction is I am very worried the Houston economy will begin to weaken significantly in 2016, and will fall into a recession in 2017. Why?

The United States is awash in the two major energy commodities. We have too much oil and too much natural gas. Oil is an “international commodity” for this discussion as its price is heavily influenced by international events. Saudi Arabia has decided not to reduce its oil production even as oil prices collapse worldwide. They claim they do not want to lose market share, a legitimate argument, but they are also hurting their enemies like Russia and Iran without firing a single bullet. They are also trying successfully to hurt the U.S. fracking industry. As a bottom line item though – the new Saudi King’s first budget shows a $98 billion deficit so the country must keep pumping oil, no matter what the price. In fact, the Saudi-led OPEC has actually produced a record amount of oil in the past three months.

Natural gas, on the other hand, is much more an “American commodity” for this discussion. The price of natural gas is primarily focused on current U.S. weather patterns and the amount of gas in storage in the U.S. America produced 6.7% more natural gas in 2015 than 2014, and now has a record surplus of gas in storage.

Both oil (WTI) and natural gas face a slippery slope (pun intended) in 2016.

The Houston economy will suffer significantly from the ongoing collapse in the price of both oil and gas. Oil prices will continue to fall, more than likely down to the mid to high $20s as the Saudis will continue to pump their oil at record levels. Goldman Sachs has a more dire prediction. Their analysts feel oil will have to drop to $20 a barrel in order to get the significant cuts in WTI production required to get higher prices. (The weekly rig count only dropped three last week.)

Natural gas prices will remain at 15-20 year lows as we will continue to have record levels of gas in storage, more than likely pushing the upper limits of our total capacity by September-October. These low energy prices will lay open for the entire world and investors to see the management deficiencies of many of our local energy companies.

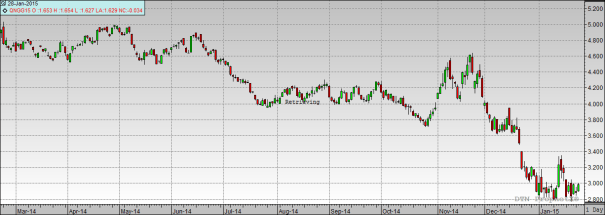
Let me highlight a few starting with Kinder Morgan, the Houston-based pipeline company. Analyst Kevin Kaiser of Hedgeye called Kinder Morgan “a house of cards” in September, 2013. For the past two years Mr. Kaiser has taken a great deal of heat for his analysis of the company as well as his “house of cards” statement. Ladies and Gentlemen – he may have been very accurate in his critical remarks regarding Kinder’s management. In 2013 Mr. Kaiser said, “I think there are some very misleading statements with some of the non-GAAP financials,” and he did not think “Kinder Morgan’s stock is safe for investors.” How soon investors forget the financials of Enron.

At that time in 2013 13 analysts had “BUY” ratings on the stock and 6 others recommended “HOLD” ratings. Mr. Kaiser recommended a short position in the stock. No one else had a sell recommendation. Kinder’s stock traded in the $40 range with a high in 2015 of $44.71 before it dropped to a low of $14.22, a 68.2% plunge, when the company finally stopped borrowing more and more money to pay its dividend, one the concerns Mr. Kaiser had also pointed out. The company also lowered its dividend 75% and the stock collapsed. Jim Kramer on CNBC staunchly defended the company right up until the stock price collapsed.   Kevin Kaiser of Hedgeye was the only analyst to see this clearly two years ago.   Investors who followed the Hedgeye recommendation and shorted Kinder Morgan made money generally. Kinder still trades at a ridiculously high PE ratio of 31 today. (2015 close = $14.92) Buyer beware…

With low interest rates savers have been looking for higher returns on their money so many went into the stock market and invested in “safe” high dividend paying stocks. This helped push stock prices up to new highs over the past few years. Many energy companies in the Houston area fit this model. They continue to pay relatively high dividends compared to the market even as commodity prices collapse. Some have gone into the bond market to BORROW the monies only to pay their unrealistic dividends, like Kinder Morgan, because they know their stock prices will fall, like Kinder’s, if they cut the dividend.

Conoco Phillips, and others, have continued to borrow hundreds of millions of dollars in order to pay a fat dividend to shareholders. Conoco’s yield currently is a hefty 6.44% when they have NO EARNINGS. Management again is kidding themselves into believing oil prices will go up soon. We have a lot of horse manure in Texas and so many companies in Houston keep shoveling it to their investors. These policies lead to devastating results for their investors and employees. Conoco Phillips had a high share price of $70.79 per share in 2015, and they did not have any earnings. THEY DID NOT MAKE MONEY. (2015 close = $46.69) Buyer beware…

Up in Oklahoma City Chesapeake Energy will probably default on their debt soon after that company has been so poorly managed over the years. Chesapeake’s stock had a high this year of $21.49 (what were those folks smoking at the time?) and a low of $3.56. (2015 close = $4.50) Buyer beware…

NRG Energy was a power generation company in 2007 with several electricity generation plants in the Houston area. It is now headquartered in Princeton, NJ, and Houston, TX. When deregulation of the Texas electricity market took effect in 2002 the utility monopoly in Houston, Houston Lighting & Power (HL&P), was broken up into three separate companies – Reliant Energy (the retail customers), Texas Genco (the power generation), and CenterPoint Energy (the pole & wires). NRG Energy bought Texas Genco from a group of private equity firms in late 2005 for roughly $5.9 billion. NRG Energy acquired the “Reliant” name and the customer list of Reliant Energy in May 2009 when Reliant basically went bankrupt after the third quarter of 2008 owing NRG upwards of $2 billion for power they purchased from the generator.

In November, 2010 NRG extended its retail customer footprint with the acquisition of Green Mountain Energy. In March, 2015 NRG extended its retail market further with its acquisition of Cirro Energy from Virginia-based Dominion Resources. Other acquisitions included the roll-up of two bankrupt power generation companies, called GenOn Energy, in December, 2012 for $1.7 billion. In August, 2013 NRG acquired Energy Curtailment Specialists, a Buffalo, NY-based “Demand Response” company (terms were not disclosed). In September, 2014 NRG acquired GoalZero, a manufacturer of personal solar power products.

Borrowing all of these billions of dollars in order to produce and sell electricity primarily in the Texas market which already has the lowest cost electricity rates in America finally caught up with the rapidly expanding NRG. My understanding is the Green Mountain Energy division is hemorrhaging cash at the moment. In September, 2015 Wall Street forced NRG to spin off all of its “clean energy” assets into a new public company, “GreenCo”, which was scheduled to begin trading in January, 2016. (Wall Street loves fees, fees, and more fees…) David Crane, CEO and the architect of all of the forward-thinking clean energy diversification, was let go (fired) by NRG on December 3, 2015. NRG Energy had a loss in 2015, but the stock had a high of $28.39. Normally when the CEO leaves a company whose stock is falling the stock generally takes a jump upward on the announcement. Instead NRG’s stock fell to a new yearly low of $8.80. Not a good sign.

It may be a good idea to track the new “GreenCo” stock in 2016, but it is my understanding now in the last week of December the key investor/private equity firm on this deal has pulled their support, and “GreenCo” may not launch soon. Another very poor sign.

CenterPoint Energy does trade on the NYSE and is the monopoly now in the Houston electricity market. CPE has quietly raised its prices per kWh for its poles & wires fees by 80% over the past ten years. The highly leveraged NRG Energy stock should be avoided until oil and gas prices reverse their downward projection, and we have had a chance to evaluate the new management team. I am not optimistic. (NRG 2015 close = $11.77) (CPE 2015 close = $18.36) Buyer beware…

2016 Predictions:

The Saudis will continue to pump oil in order to hurt their enemies and competitors (sometimes one in the same…). Oil prices will continue to drop and many Texas oil & gas companies will be forced into bankruptcy (22 filed in 2015/36 companies overall). 70,000 oil jobs were lost in the U.S. in 2015, and more will be lost in 2016 & 2017. Nine companies filed for bankruptcy protection in just the fourth quarter of 2015, and they alone had over $2 billion of debt.

The “El Nino” weather pattern this winter will keep colder weather out and warmer weather dominant in the northern U.S. (72 degrees in NYC for Christmas Eve…) so we will continue to build a surplus of natural gas in storage. Two of the smallest drawdowns from gas storage in any December since they have kept records have taken place these past two weeks this year. We will run out of storage capacity in September or October if the pace of production continues with an expected increase of another 1.5% in 2016. Do we just give gas away then?

My predictions –

Oil (WTI): $25 – $28 p/barrel low (2015 close = $37.04);

Natural Gas: $1.35 – $1.50 p/contract low (2015 close = $2.337);

Gold: $1,175 – $1,200 p/oz. high (2015 close = $1,059.10)

Dow Jones (DJIA): 15,400 – 15,600 low (2015 close = 17,425.03);

S&P 500: 1,800 – 1,825 low (2015 close = 2,043.94);

NASDAQ: 4,250 – 4,500 low (2015 close = 5,007.41);

Junk Bonds: Many energy companies borrowed money heavily for fracking and exploration when oil was $75 per barrel or higher. Many investors looking for a higher yield on their money invested in “high yield bond funds” which generally invest in risky junk bonds. Somewhere between 15% – 20% of all junk bonds are in the oil & gas industry. We will see a significant number of these bonds default in 2016. Several bond funds closed their doors to redemptions shortly after the Federal Reserve raised interest rates even slightly because of the lack of bids to buy their bonds. Buyer beware…

ENRON look-a-like: SunEdison (Beware of financials that do not make sense…) (2015 close = $5.09)


I have not painted a real positive picture for the markets in 2016. If you like to drive your car you will have plenty of cheap gas. Your electricity rates in Texas will be the lowest in the U.S. and the lowest in 15 years.

Otherwise, fasten your seat belts. Pull those shoulder harnesses tight. The Federal Reserve has once again contributed to building “bubbles” in stocks, housing prices, and things like art pieces. Remember what happened in 2007 – 2008 when these bubbles burst the last time. Remember back to the mid-1980’s in Houston, Dallas and Oklahoma City. We will see a significant slowdown, probably a recession, in Houston soon.

In the stock market – there was no reason for anyone to buy Chipolte Mexican Grill stock at more than $750 per share. With its recent collapse it still trades at an unrealistic 29.5 PE ratio. (2015 close = $479.85) How can Tesla trade above $240 per share when they lose money on every car they sell? Do they make it up in volume? (2015 close = $240.01) Buyer beware…

Best wishes and good luck in 2016.


Doug Mathes

Power Energy USA

November 2015 Natural Gas Prices Report

Natural gas prices have a significant impact on electricity rates in Texas, each trading in a parallel pattern. As natural gas prices drop so do electricity rates because gas is the major commodity used in producing electricity. And it should be noted also deregulated electricity rates in Texas are the lowest in the nation.

Natural gas contract prices trade primarily based on the amount of gas in storage and the current weather patterns (supply & demand). Let’s review the numbers over the past three years –

November, 2012 – 3.969 Trillion Cubic Feet (TCF) record amount of gas in storage (4.0 TCF estimated maximum capacity). Electricity rates established new lows;

January, 2014 – The beginning of a brutally cold winter across the nation. Natural gas contract prices exceeded $6.50 for the current contract that month, and electricity rates rose significantly;

April, 2014 – Because of the brutally cold winter weather natural gas in storage fell to an 11-year low of 1.008 TCF.

The amount of natural gas going into storage then began to increase primarily due to fracking, resulting in a record 30 straight weeks of additions exceeding the 5-year average to the amount of gas going into storage, which was a new record. Read the rest of this entry »

September Electricity Prices

There are two important components that go into electricity prices. Those of you who have followed my writings know natural gas prices have a direct effect on electricity prices and generally move on parallel planes. The second, and an equally important piece to the puzzle, is the time of the year which highlights the seasonal usage of electricity.

As the current administration pushes the use of coal as an evil, and makes natural gas a more acceptable fuel to fire our power generation plants, natural gas pricing becomes an even more important indicator of current and future electricity prices.

Electricity prices generally look like a camel if charted out over a 12-month period. We have a peak in prices when we are using our furnaces in the Winter as a great deal of the country uses electricity and natural gas for heating their homes and businesses. In the Summer months we find a similar peak in usage of gas and electricity as we crank up the air conditioners in July & August.

In between we find significant low spots when in the Spring time we finally get to turn off the furnace and open the windows for the first time in months. In the Fall we get to turn off the air conditioners and open the windows up again. These are the times you want to find the lowest electricity rates for your home or business.

Basic high school economics classes tell us the world runs on “supply and demand.” The greater the demand the higher the price. The greater the supply the lower the price. Duh… Read the rest of this entry »

Energy

Yesterday we found out we have more oil in storage than at any time since 1930.

Today, the natural gas storage report was again bearish. The analysts were expecting a draw down of 119 bcf and we only had a draw of 115 bcf.

The most important aspect is you may remember my mentioning that last April we were a trillion cubic feet under the five-year average for gas in storage (1008 bcf…). Well, as of this report we are only 29 bcf below the 5-year average and are producing gas 15% greater than last year, another record.

The current gas contract fell to $2.578 after the report was released. That is the lowest price for natural gas since August 2012. I thought we would see gas at $2.50 this Spring – I just didn’t think it would be this fast.

Low electricity rates should be with us for awhile as I cannot see gas going above $3.35 any time this year.

Natural Gas/Electricity

“The Sky is Falling” – SELL SKY!

Natural gas production continues to reach record levels, and is best illustrated by today’s natural gas storage report.

The analyst’s predictions were for a winter draw down of natural gas of 123 bcf which was still below the corresponding week last year and within the 5-year average. BUT, the report shows a draw down of only 94 bcf.

This unusually small draw now puts the amount of gas in storage at 324 bcf above last year and only 79 bcf below the 5-year average. We have progressed a long way from the 1,008 bcf of gas below the 5-year levels we saw last April. We have closed the gap significantly.

And natural gas has sold off with the current contract dropping to $2.722 so far this morning, the lowest in two and a half years. This means we have lower electricity rates in our future. I would not be surprised to see gas reach $2.50 sooner than I had expected.

Go make your customers happy!

1-28-2015 Market Commentary with NG Chart

Natural gas prices are falling back as production appears to be edging higher.

Natural gas for February delivery is down 11.4 cents, or 3.8%, at $2.867 a million British thermal units on the New York Mercantile Exchange. The front-month contract hasn’t had back-to-back sessions of gains or losses in more than a week.

The more actively traded March contract is down 10.4 cents, or 3.5%, at $2.831/mmBtu. The February contract expires Wednesday at close.

“There is ample … gas in inventory to meet the demand of the remaining winter season even it is colder than normal,” Dominick Chirichella, analyst at the Energy Management Institute, said in a note to clients.

Half of U.S. homes use natural gas for heat, making winter cold typically the biggest driver for demand. But prices have plummeted 36% since November because record production has been enough to easily cover demand, even in the coldest weeks of the year.

And that production is still edging higher, according to Citigroup Inc. Producers are extracting more in several gas-rich shale formations, especially the Marcellus, its analyst Anthony Yuen said in a note to clients Wednesday. They are quickly recovering from cold weather that can choke off supply and they keep making technological advancements that allow each well to produce
more, he said.

That production is on pace to create a surplus of more than 4 trillion cubic feet for natural gas storage, beyond its practical capacity, Mr. Yeun said. Prices for both 2015 and 2016 will have to come down another 30 cents/mmBtu in order to get power producers to buy the gas that can’t go into storage, he said.

Physical gas for next-day delivery at the Henry Hub in Louisiana last traded at $2.87/mmBtu, compared with Tuesday’s range of $2.93-$2.97. Cash prices at the Transco Z6 hub in New York traded in a bid-ask range of $4.25/mmBtu to $5.00/mmBtu, compared with Tuesday’s range of $8.95 to $12.00.

1-28NGChart

Click here to view full version.

Energy Costs

Welcome to the uncertainty of the New Year.

Natural gas will remain a significant product in producing electricity, especially in Texas, and therefore continues to bear watching as the price of gas runs somewhat in parallel with electricity prices. The price of oil, on the other hand, has little to do with the price of natural gas or electricity, but has a huge impact on the economy, especially in Texas.

We are seeing some of the lowest prices for electricity and natural gas in the last two years. Natural gas is trading on the current contract near $2.90 today, a little above the $2.80 low point it hit within the last couple of weeks. It appears now gas has built a significant price ceiling around $3.25, and will not go higher unless we have a major change in the weather up north.

This week’s natural gas storage report that came out yesterday showed a draw down of 131 Bcf. Even though the average analyst forecast, as surveyed by the Wall St. Journal, was for a smaller draw of 119 Bcf the market was fairly steady. The reasons are two-fold:

1) the weather next week is expected to once again this winter be ABOVE normal for this time of the year; and more importantly 2) production continues to set records for natural gas. Read the rest of this entry »