Natural Gas Update

As you are aware, natural gas prices directly impact electricity costs, especially in Texas. We saw another very interesting development with this past Thursday’s storage report.

The analysts collectively were looking for a build up of 96 bcf. Thursday’s report only came out with a build of 90 bcf. Normally that would produce a significant run-up in natural gas pricing, but the current (August) contract only went up 8.5 cents in trading Thursday after the report was released.

On Friday prices DROPPED 6.6 cents after investors realized 1) cooler weather still was forecast for the Mid-West; 2) the 90 bcf increase was 47 bcf greater than the corresponding week of last year; and 3) it was 44 bcf greater than the corresponding week for the 5-year average. That is HUGE!

The new current contract (September) closed Friday at $3.787 begun trading today already down another 4 cents. I believe pricing for natural gas has fallen into a new trading range between $4 and $3.60. Electricity prices will be lower this summer due to the drop in gas prices, and with the cooler weather. Customers should take advantage of this and lock in long term rates. Record natural gas production should help us maintain low prices through October when we will see whether this winter will be as cold as last winter.

Click here to view a chart detailing the new trading range.

Natural Gas Storage Report

Wow!! We had another triple digit jump in natural gas in storage.

Today’s storage report surprised a lot of people as we had an increase of 107 bcf of gas in storage, and the current contract price dropped BELOW $4 for the first time since early January.

Once the report was released gas pricing dropped to $3.98. This means electricity prices will be headed down as well in the short term. The record production of gas this year is eliminating all fears we will not have enough gas in storage for another cold winter.

Enjoy the lower prices!!!

Natural Gas/ Electrcity

Because we have seen twelve weeks of above-average gains in natural gas storage figures we are now seeing the easing of concerns about having enough gas for the cold winter months this year.

Hedge funds reduced their net-long (Bullish) positions last week by 8.1%. Pricing for natural gas contracts is easing and hit a low +today of $4.092, the lowest since January.

My suggestion is to lock in +today’s pricing soon as we are at reasonable lows on gas and electricity pricing right now, and if we get a surprise (negative) storage report on an upcoming +Thursday soon we will see a significant immediate spike upwards in pricing.

World Sets New Oil Production and Consumption Records

Last month BP (NYSE: BP) released the Statistical Review of World Energy 2014. This report is one of the most comprehensive sources of global and country level statistics on production and consumption of oil, natural gas, coal, nuclear power and renewables. Right after the release of the report, I wrote a short post discussing the highlights. Today I will take a deeper dive into oil production and consumption figures. In coming weeks, I will delve into the rest of the report.

Oil Production

First a note about BP’s definitions. “Oil” in the BP Statistical Review (BPSR) is defined as ”crude oil, tight oil, oil sands and natural gas liquids”, but excludes biofuels and liquid fuels produced from coal or natural gas. Consumption numbers do include all liquid fuels, so consumption numbers are always greater than production numbers, but this is merely an artifact of BP’s definitions.

Global oil production advanced in 2013 by 557,000 barrels per day (bpd), reaching a new all-time high of 86.8 million bpd (an increase of 0.6 percent over 2012). After declining in 2009, global crude oil production has now increased 4 years in a row. But as I noted in last month’s short article, while global oil production did indeed set a new record, the US production increase alone was 1.1 million bpd. Thus, outside the US global production actually declined by 554,000 bpd.

US Oil Production 1965 through 2013 Fracking

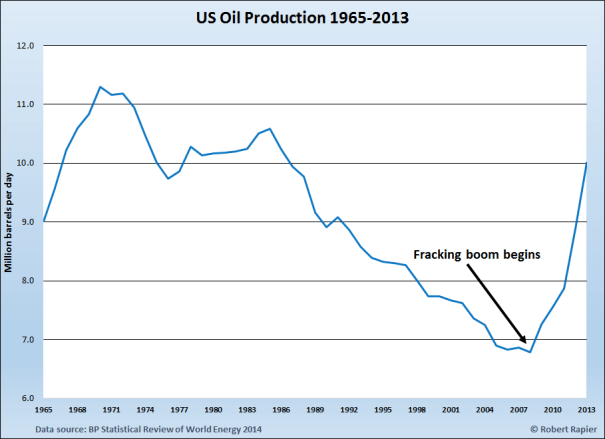
The 1.1 million bpd gain in US oil production was the largest year over year gain for any country in 2013, and the largest gain in US history. For perspective, the second-largest increase in oil production was recorded by the United Arab Emirates with a gain of 248,000 bpd over 2012, and Canada was the only other country in the world to record an increase of more than 200,000 bpd, at 208,000 bpd over 2012. The US remained the world’s third-largest oil producer at 10 million bpd in 2013, trailing Saudi Arabia’s 11.5 million bpd and Russia’s 10.8 million bpd. Rounding out the top five were China (4.2 million bpd) and Canada (3.9 million bpd).

Just to put the current US oil boom into further perspective, over the past five years global oil production has increased by 3.85 million bpd. During that same time span, US production increased by 3.22 million bpd — 83.6 percent of the total global increase. Had the US shale oil boom never happened and US production continued to decline as it had for nearly 40 years prior to 2008, the global price of oil might easily be at $150 to $200 a barrel by now. Without those additional barrels on the market from (primarily) North Dakota and Texas, the price of crude would have risen until supply and demand were in balance.

Libya had the largest decline of any country due to military action there. Oil production fell in Libya by 521,000 bpd, a 35 percent loss from 2012. Production in Iran was down nearly 200,000 bpd, while military action also impacted Syria’s production, which fell 115,000 bpd. Production in Saudi Arabia and Nigeria was down about 100,000 bpd from 2012.

Oil Consumption

Oil accounted for 33 percent of all the energy consumed in the world in 2013. Globally, oil demand increased by 1.4 million bpd over 2012 to 91.3 million bpd, keeping upward pressure on crude prices throughout the year. After two years of declines, US consumption increased by 397,000 bpd – a 2 percent increase from 2012. While much has been made of a slowdown in China, oil demand there still increased by 390,000 bpd (following a 500,000 bpd increase from 2011-2012). Despite the slowdown in the rate of growth from the previous year, this represented a 3.8 percent consumption increase for China, 2.5 times the global increase of 1.4 percent.

Together the US and China were responsible for 56 percent of the global increase in oil demand in 2013. The big difference between the two countries is that US oil production was up far in excess of our increase in consumption, while oil production in China edged up by only 24,000 bpd. This means that while US oil imports declined and finished product exports (e.g., gasoline, diesel, jet fuel) increased, China’s dependence on oil imports continued to increase.

Double-digit percentage increases in oil consumption were recorded by Pakistan, Venezuela, and Azerbaijan from 2012 to 2013, and over the past five years double-digit percentage consumption increases were recorded by Central and South America (15.2 percent), the Middle East (18.3 percent), Africa (12 percent), Asia Pacific (17.4 percent), and the former Soviet Union (12.8 percent). Oil demand in the developed countries belonging to the Organisation for Economic Co-operation and Development (OECD) decreased 5.3 percent over the past five years, while demand in non-OECD countries increased 20.3 percent.

Change in Oil Consumption

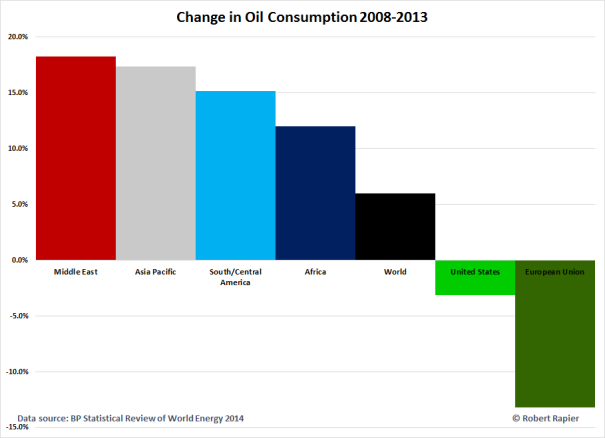
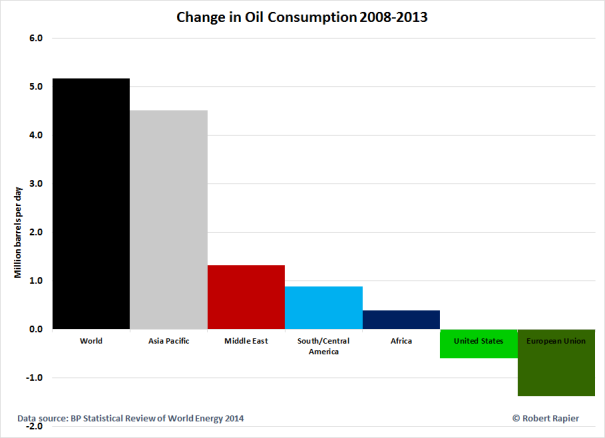
After posting the above graphic to my Twitter feed, several asked if I would reproduce it in barrels per day. I have to agree that this really puts Asia Pacific’s influence on global oil demand growth in perspective. Over the past 5 years, 87 percent of the demand growth for oil came from the Asia Pacific region:

Change in Oil Consumption MMBPD

Oil Prices

The loss of oil production from Libya and strong demand in developing countries ensured that oil prices remained high, despite surging US production. Contrary to expectations — given a tighter supply/demand picture for international crudes — Brent crude declined by $3.01 from 2012 to a yearly average of $108.66/bbl. Prices for West Texas Intermediate (WTI), on the other hand, actually averaged $97.99/bbl for the year, an increase of $3.87/bbl from 2012.

Conclusions

The story of oil in 2013 was one of surging US production and increasing demand in developing countries. The US continues to lead the world in increasing oil production, while developing countries — in particular the Asia Pacific region — have added the vast majority of oil demand in recent years. Arguably the only thing preventing the world from experiencing oil prices in the $150-$200/bbl range is the continuing shale oil boom in the US.

Link to Original Article: World Sets New Oil Production and Consumption Records

Natural Gas & Electricity

Hello Folks –

It has been a very interesting start to our week for natural gas and electricity. On June 26 we moved to the August contract as the current natural gas contract, and we had a build in storage of 110 bcf. The price for gas hung around the $4.45 market for a few days before our latest storage report last Thursday.

For the eighth straight week (a new record) we had a triple-digit build in the amount of natural gas in storage. Last week’s report showed a build of +100 bcf. This put our current amount in storage 666 bcf below last year’s number and 790 bcf off the 5-year average.

You may remember from my earlier reports I talked about the need to exceed the 5-year average EACH WEEK by 25-30 bcf in order to get back to a comfortable level of gas in storage for this Winter’s colder months. On April 24th we were down 1008 bcf of gas from the normal 5-year average for that corresponding week. We have exceeded the 5-year average each week since then, and the increase itself keeps growing each week. That is significant.

Four weeks ago the build was +19 bcf over the 5-year average. Three weeks ago it was +26 bcf. Two weeks ago it was +29 bcf. This week it was +32 bcf. These numbers tell me production of natural gas is growing and will probably produce a record year in the production of natural gas.

Yesterday, July 7th, we saw the biggest one-day drop in price for natural gas since February 26th, down 18.1 cents. This drop broke through the support area I have previously mentioned of $4.30, closing yesterday at $4.225 after hitting a low of $4.20. This closing price was the lowest since January 10th of this year. And today the drop continues with the current price down another 8.5 cents. These prices are the lowest in 6 months.

The reason for the drop is 1) the storage numbers continue to look better each week; and 2) the weather reports all look for a continuation of the mild summer temperatures this year. I didn’t think we would see $4 or below pricing on gas before September, but we could be headed there earlier than the Fall.

This bodes well for electricity prices as they continue to fall right along with the price of gas. Gas fires the majority of the power plants in Texas. Look to lock in these low rates as any negative storage report could reverse this trend quickly.

Click here to view a chart detailing the prices.

Electricity in the Summer

Happy Friday –

Once again, we had an excellent natural gas storage report come out yesterday. The analysts were looking for a build up of +102 bcf, and we got an actual build of +110 bcf. That makes it seven weeks in a row natural gas has increased over 100 bcf in storage which I believe becomes the new record.

More important, this week’s increase in gas was 16 bcf greater than the corresponding week last year, and 29 bcf above the 5-year average. This still leaves us 822 bcf below the 5-year average. The new current natural gas contract (August) came down to close at $4.441 on +Thursday, and is down another 5.5 cents +today.

I believe we are looking at the lowest point for gas and electricity rates now until later this Fall as we start the warmer weather and the air conditioners kick in. All clients with electricity contracts coming up within the next four months should lock in rates NOW because rates will be going back up soon as we start hearing about “above average” temps this Summer.

The gas in storage is significantly below the five-year average because of the horrible Winter weather we endured this year and we used gas to fire the electricity power plants as well as heat our homes up north. If we run into significantly hot temps this Summer we will see a squeeze in natural gas with a spike in electricity rates probably in August.

Customers who do not sign up now to lock in this week’s rates may find “sticker shock” come August if they wait. Some customers may want to gamble and just go month-to-month with ERCOT’s real time rates. That is a HUGE GAMBLE. All we need to look at is the real time rate in August 2011 when Texas had ten days of record temps and record demand for electricity. This year could be worse.

Each year Texas has 400,000 more people move to our great state. They all use electricity. The commercial customers continue to expand as we employ these new folks coming to the Lone Star State. Obama’s EPA too has tried to drive the cost of electricity up with their new coal regulations. And this year we add the fact we already have 822 bcf less gas in storage with fears we will not have enough to heat our homes in the Winter, and you have the potential of the most significant spike in prices ever.

This is the year, with all of the problems listed above, we could find the highest daily rates ever. We currently have electricity rates in the low 5 cent range. The average daily rate in August of 2011 when we had the last spike due to record heat in Texas was 13 cents with some days above 30 cents per kWh. Customers should not take this gamble this year.

Lock in the low fixed rates today.

Natural Gas – Electricity

It’s Thursday morning and we have another significant natural gas storage report which will affect electricity prices and gas prices in Texas, as well as nationally.

The analysts were expecting an increase build-up in the amount of gas in storage to be +110 bcf. The report showed a nice build of +113 bcf. The price of the current natural gas contract was down about one cent before the report, down about 5 cents immediately after the report came out, and is currently down around 3 cents. Not much change overall in today’s pricing.

The significance of today’s report is it is the SIXTH week in a row where we have had a build-up in the supply of natural gas in storage of more than 100 bcf. Only one other time did we have a five week period of +100 increases. We have now exceeded the five-year average increase nine weeks in a row.

BUT, natural gas in storage at this moment is still at the lowest point in 11 years. I believe we will see a record increase of gas in storage for the April to October time period this year of + 2.6 tcf. Such a record build-up would put our supply of gas in storage at 3.4 tcf going into the November to March winter months. This would still leave us with the smallest reserve in storage since 2005.

The majority of analysts expect a significant price spike going into the winter months, even if we reach 3.4 tcf in storage. I lean in the other direction as I believe due to the record gas production from our development of shale deposits we will see the power generation plants, the huge users of gas, be able to use more gas from actual production and not be required to draw down as much from the gas in storage this winter.

Overall, I don’t see any significant changes in gas prices, and therefore electricity prices, in the coming months unless we have a significant stumble in the storage numbers along the way. I see production to continue beating the five-year average month after month, and natural gas to continue to trade in its current trading range between $4.30 – $4.93.

Natural Gas

It appears fairly certain now with today’s natural gas storage report numbers that we have seen our low prices for the Spring and Summer for natural gas and electricity. The air conditioner weather and potential hurricanes will now become the primary factor in pricing between now and September/October when the amount of natural gas in storage will be a big story again.

The analysts were looking for a build up in inventory of natural gas in storage of 111 bcf, but today’s report shows only a build of 107 bcf. On the surface this does not appear to be a bad report, but the market did not like it. The current natural gas contract has jumped over 25 cents today.

The increase of 107 bcf in storage was 10 bcf over last year’s corresponding number and 19 bcf over the corresponding 5-year average number, but it was 4 bcf under what the market was looking for today. Last week we EXCEEDED the analyst’s estimate by 3 bcf, and gas still went up 6 cents that day. Therefore, the storage numbers are only confirming to the traders Deutsche Bank was correct and they should buy, buy, buy. Up go the prices.

President Obama’s EPA has taken his agenda regarding carbon emissions and are going to implement what Congress voted “NO” regarding the “Cap & Trade” carbon tax. Their new regulations will make it impractical to run coal-fired power plants. That means these plants will have to shift over to natural gas or some other fuel, gas being the cleanest. The same environmentalists won’t allow us to build nuclear power plants, the cleanest, and other new power generation plants are too expensive now to build unless the cost of electricity goes up substantially.

You may remember Obama’s speech in San Francisco when he said everyone would pay “MUCH HIGHER ELECTRICITY BILLS” after he got his “Cap & Trade” policy implement. It has arrived.

My point – companies when they renew their electricity contracts should look at signing up for the longest term they can get, generally 4 or 5 years, to lock in today’s electricity rates for as long as they can at this time because we will more than likely see much higher rates in the future. And they should do everything possible to reduce their usage and their demand factor as well.

US natural gas output will set a record this year

U.S. natural gas output will reach 73 billion cubic feet a day for the first time this year as new pipelines tap into shale supplies stranded in the Marcellus formation in the Northeast, a new government report showed.

Marketed gas output in the lower 48 states will increase 4 percent from 2013, setting a record for the fourth straight year, according to the U.S. Energy Information Administration’s Short-Term Energy Outlook, released Tuesday in Washington. The production estimate was raised from 72.26 billion in last month’s report as “several new projects to support Marcellus production have either recently come on line or will begin operations later this year,” the government said.

The EIA left its 2014 price outlook unchanged at $4.74 per million British thermal units as the gains in shale output are partly offset by increased gas use. Gas inventories fell to an 11-year low in March after a frigid winter spurred record demand and hampered production, according to the EIA.

Continue Reading

Storage Report & Electricity

Each summer the price of natural gas, and therefore electricity, are impacted primarily by the weather – too hot and we use our air conditioners more, and/or we have storms in the Gulf of Mexico which disrupt oil & natural gas production.

This year we have another piece to the equation – the amount of natural gas in storage because we used such a record amount during the horrible winter weather this year and drew down our supply to an eleven year low.

You have read in my previous reports experts feel we will need to EXCEED the 5-year averages by 25 – 35 bcf of gas going into storage EACH WEEK in order to get back to the necessary levels by this winter to get us through another cold winter.

Good news! Shale production is helping us achieve record levels of new gas going into storage. Great news!

The analysts were looking for an increase of 117 bcf of new gas going into storage with this week’s storage report. The report says we exceeded that estimate, and we increased the amount of natural gas in storage by 119 bcf. Exceeding the analyst’s estimates is always good for lower prices. The current contract was trading up 2.5 cents before the report and began trading DOWN 4.5 cents right after the report’s release.

But more important – the amount of gas going into storage far exceeded the amount of build up last year for the corresponding week, and exceeded the 5-year average by a huge 26 bcf. We have now exceeded the five-year averages each week for the past six weeks, and have increased the amount in storage by 112 bcf over the 5-year averages in that time period. Secondly, the amount of the increase is GROWING LARGER each week.

Normally prices for gas and electricity start to increase this time each year as the hot summer months force us to use these commodities to run our air conditioners. I think, since prices are already so high this year due to the past winter’s weather we won’t see a significant price increase this summer. IF, and I emphasize “IF”, the storage numbers continue following the current pace of build up – we should see lower prices again, maybe back into the $3.80 range for natural gas, around September or October.

Great news!

Click here to view a chart detailing the prices.